

 Ghana
 Côte d'Ivoire
 Senegal
 Kenya
 Egypt
 South Africa
 United States
 United Kingdom
 China
 India

What this means
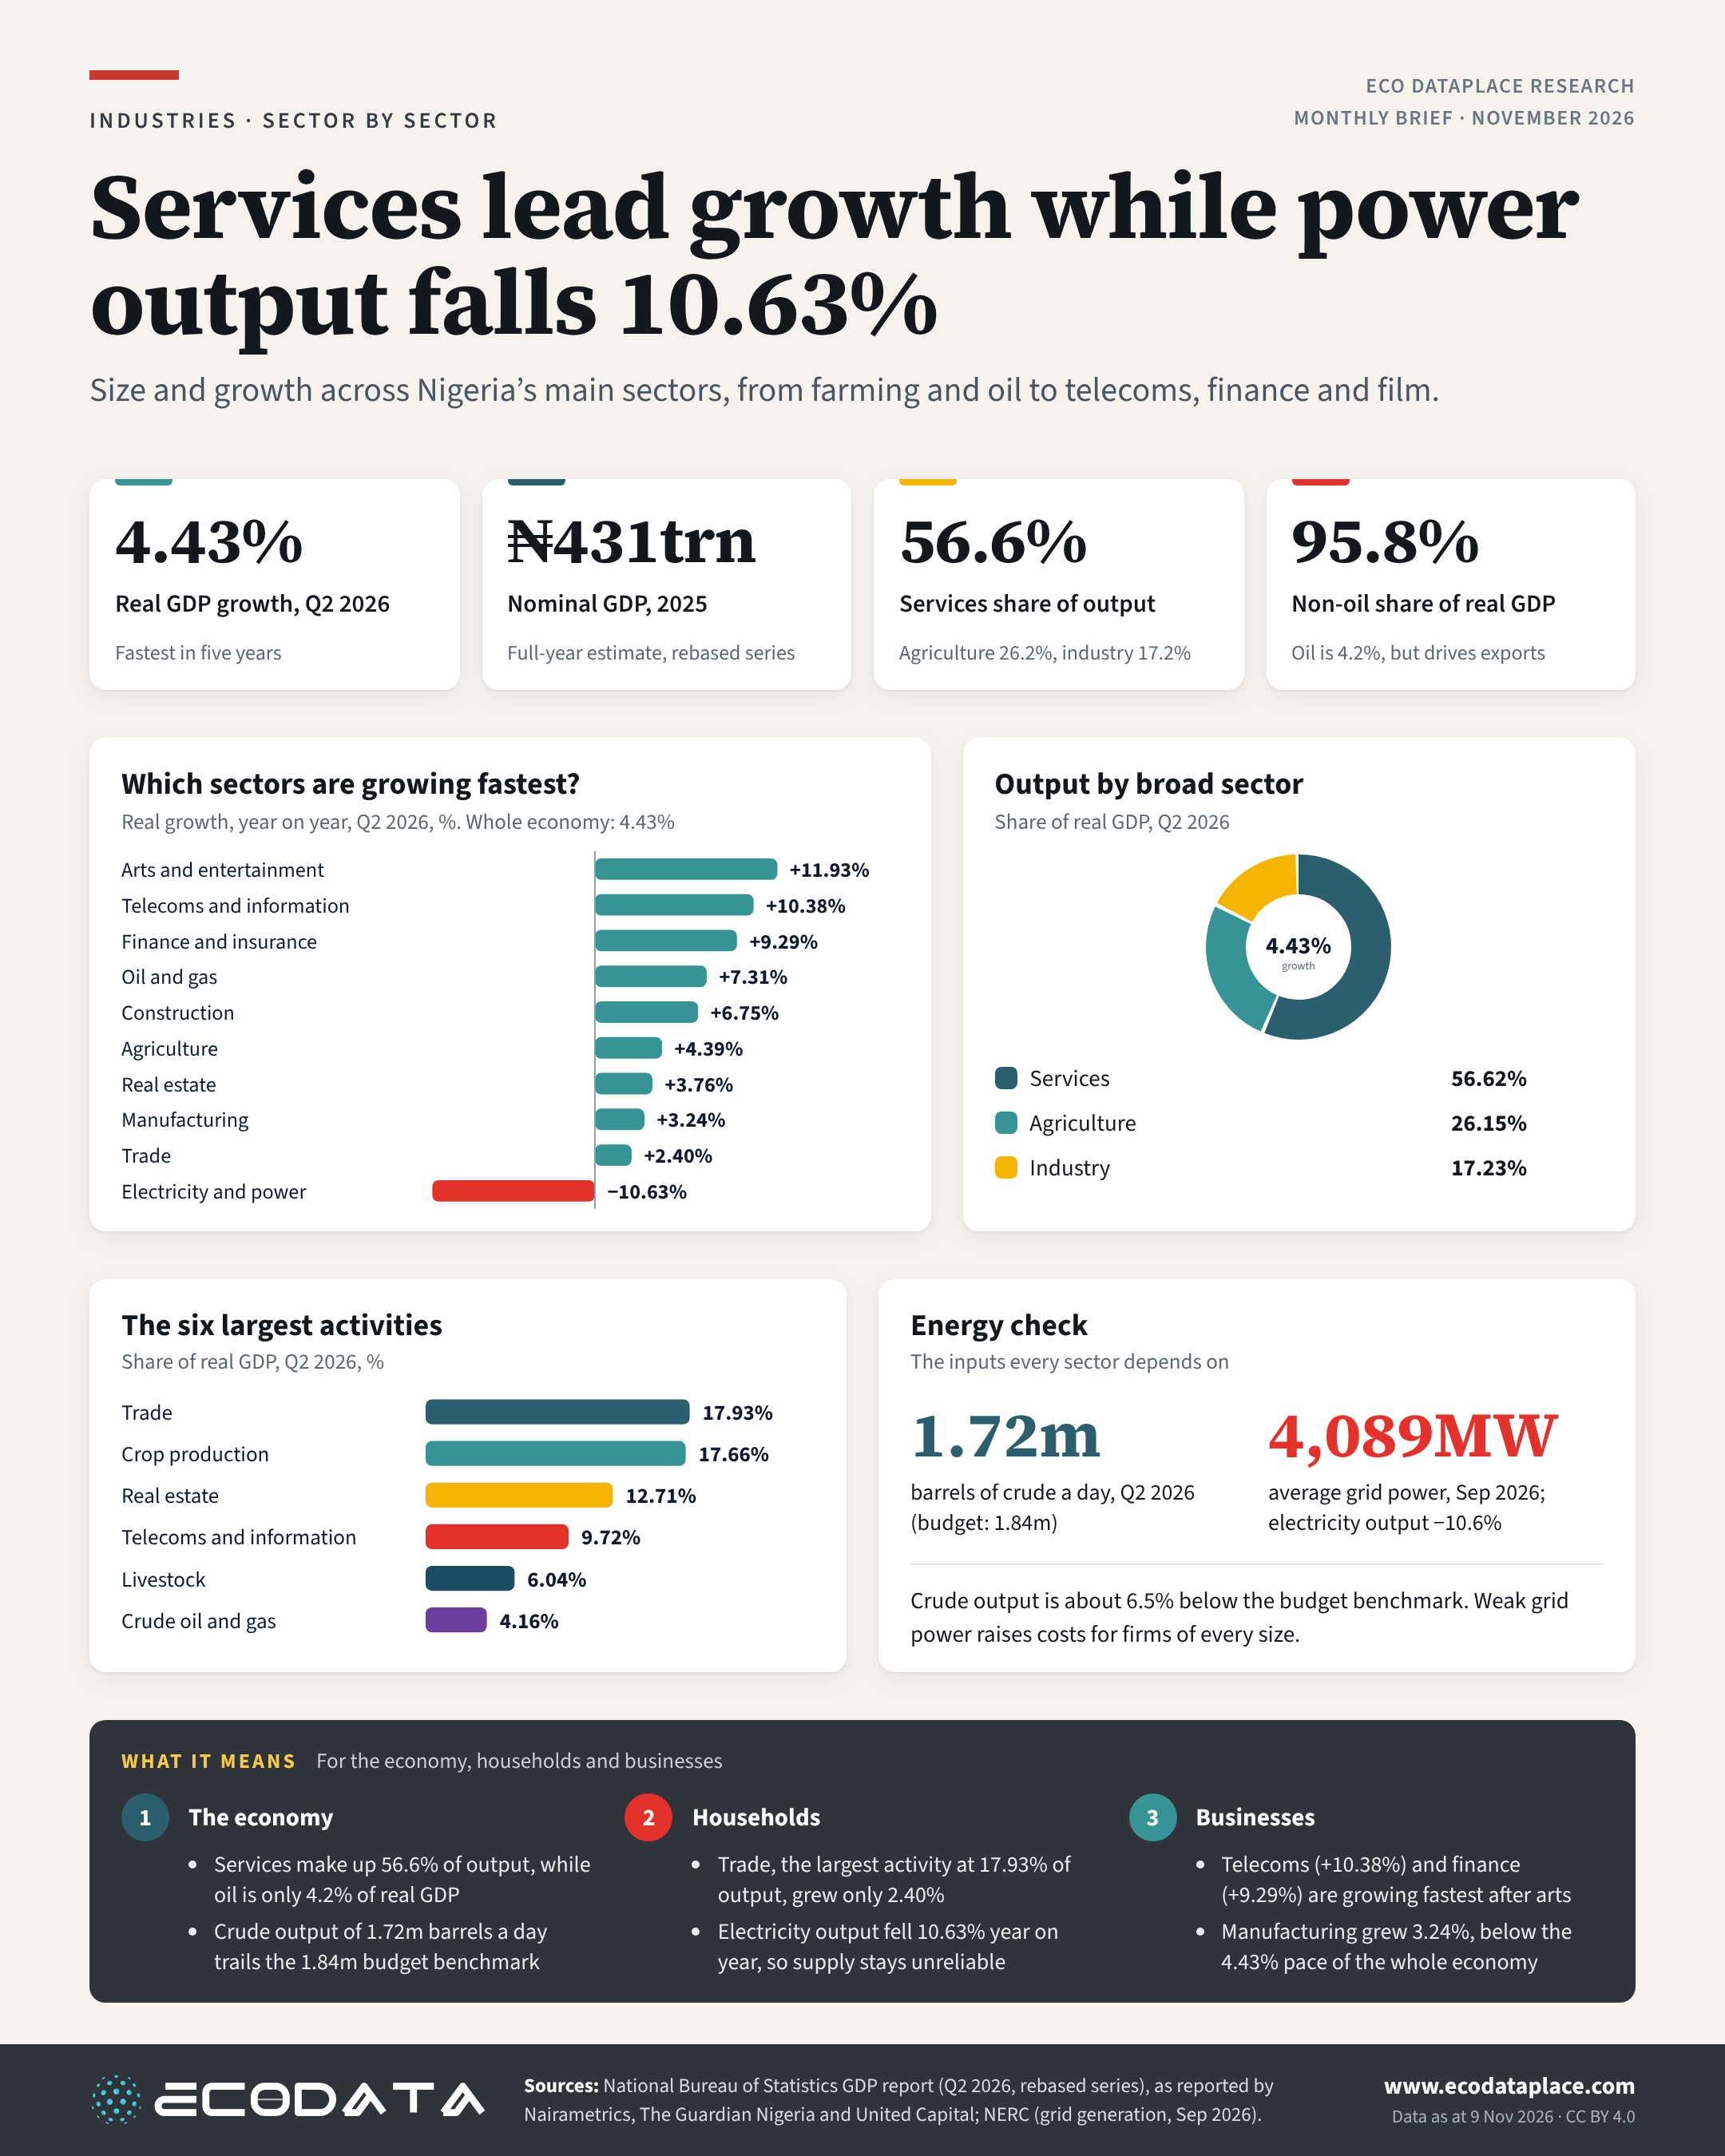
Services drive Nigeria’s economy, making up 56.62% of real GDP in Q2 2026. Growth was fastest in arts and entertainment (11.93%), telecoms (10.38%) and finance (9.29%). Electricity output fell 10.63% year on year, the weakest of the main sectors.
For the economy
Oil and gas grew 7.31% but is only 4.16% of real GDP, though it still dominates exports and government revenue. Crude output of 1.72m barrels a day in Q2 trailed the 1.84m budget benchmark by about 6.5%.
For households
Trade, the largest activity at 17.93% of output, grew only 2.40%. Weak grid supply, averaging 4,089MW in September, keeps many homes reliant on costly generators.
For businesses
Manufacturing grew 3.24%, slower than the 4.43% pace of the economy, and unreliable power raises costs for firms of every size. Telecoms and finance continue to expand faster than most sectors.
For information only; not investment or tax advice.